
1 Add tools specifically to php monitoring in order to answer the questions ⬇️
- what kind of php scripts were called most of the time?
- what kind of php scripts took the most CPU?
We choose open-source tool Pinba.
php pinba extension sends data over UDP in protobuf format. pinba server accumulates and processes data and send it to data storage in your choice. (In our case it is Clickhouse DB)
It is not a secret that the most popular script in php frameworks is index.php but this information is barely helpful. So we need some “CPU statistics per route”.
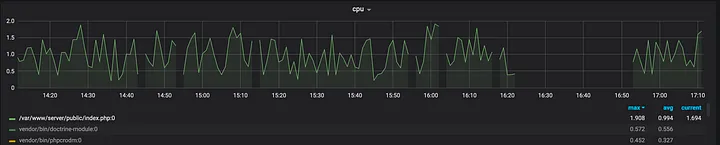
“CPU statistics per route” means that: we have to implement one more chart in Grafana that shows CPU consumption in the matter of requested route, for example, V2\Community\Model.php And only after that we can give this info to developers for investigation what kind of code took the most CPU in the route: V2\Community\Model.php When the developer got the list of routes it is time to look inside those routes and investigate what cause high CPU. On this stage Blackfire can help. Blackfire will show you CPU Wall Time. To keep things simple, Wall Time is usually split in two main parts: the CPU Time and the I/O Time.
The CPU time is the amount of time the CPU was used for processing instructions. The I/O time is the time the CPU waited for input/output (I/O) operations.
I/O time could be divided into two parts: the network and the disk.
Network activity includes calls to databases like:
- MySQL, PostgreSQL, or MongoDB;
- HTTP calls to web services and APIs;
- Calls to cache systems like Redis and Memcached;
- Communications with services like queues, email daemons, remote filesystems; etc.
Disk activity occurs when a program reads files from the filesystem, including loading code or files.
We need to distinguish these types of times in order to make further decisions related optimization.
A CPU-bound program’s speed depends mostly on the CPU. In other words, CPU utilization is high for long periods of time. The faster the CPU, the faster the code runs. On the contrary, an I/O bound program’s speed is determined by the time spent waiting for I/O. Faster disks or a faster network improve the overall performance of I/O bound code.
2 After that, depending on findings ⬇️
IF the reason of high CPU is I/O bound related to DB (too much time waiting for I/O ) then we should consider migrate to RDS and set up storage General Purpose (SSD) or Provisioned IOPS (SSD).
IF the reason of high CPU : CPU-bound (which is rare case for web applications) then we should consider to optimize algorithms in code.
to be continued… 👀